Why Low Beta Improves Value in US Small Caps?
Restricting Value to low-beta stocks improves Sharpe ratios in 8 of 9 universes. The effect is strongest in US Small Caps, where Low Beta Value nearly doubles the CAGR of High Beta Value.
This analysis was conducted using Python + Portfolio123 universes and factor definitions. Underlying data is sourced from FactSet.
- Low Beta improves Value's Sharpe ratio in 8 of 9 universes tested
- In US Small Caps, Low Beta Value nearly doubles the CAGR of High Beta Value (19.9% vs 10.2%)
- In most other universes, the trade-off is as expected: Low Beta delivers better risk-adjusted returns but lower absolute CAGR
- The pattern does not replicate in European Small Caps, suggesting the effect is market-structure dependent
1. Introduction
Low beta and low volatility factors have been part of the toolkits of useful factors for my systematic strategies. Many of the strategies that are combined in Noax Capital systems rely to some extent on these factors. The interaction with other most important factors, historically, is always an important point for empirical research, as the value factor is.
The value premium - the tendency for cheap stocks to outperform expensive ones over the long run - is one of the most studied and debated phenomena in empirical asset pricing. Since its systematic documentation by Fama and French (1992), it has been replicated across geographies, time periods, and asset classes. Yet the premium is far from stable: it is cyclical, prone to long drawdown periods, and highly sensitive to universe construction.
A parallel strand of literature documents the so-called Low Volatility or Low Beta anomaly: stocks with below-average market sensitivity tend to deliver risk-adjusted returns that are disproportionately high relative to what standard asset pricing models would predict (Black (1972); Frazzini and Pedersen (2014)). This finding contradicts the fundamental tenet of the CAPM - that higher risk should be rewarded with higher return - and has generated substantial academic and practitioner interest.
The natural question this raises is whether combining both tilts - Value and Low Beta - produces a portfolio that is more than the sum of its parts. Specifically, we ask: Does applying a Value ranking within the lower-beta half of a universe produce systematically better outcomes than applying it within the higher-beta half? The hypothesis is intuitive: low-beta Value stocks may represent genuinely mispriced, fundamentally sound companies, while high-beta Value stocks are more likely to include "value traps" - firms that appear cheap precisely because the market correctly anticipates structural deterioration.
2. Theoretical Background
The interaction between Value and beta has received increasing attention in the factor investing literature. Novy-Marx (2013) showed that the Value premium is closely related to profitability, and that controlling for quality substantially sharpens Value signals. In a related vein, Asness, Frazzini, and Pedersen (2019) document that the "Quality minus Junk" factor interacts powerfully with Value: stocks that are both cheap and high-quality deliver significantly better risk-adjusted returns than those that are merely cheap.
Low-beta stocks share important characteristics with high-quality stocks: they tend to have more stable earnings, lower leverage, and more predictable cash flows. This suggests that the Low Beta filter, when applied prior to Value selection, may serve as an implicit quality screen - removing from the opportunity set the most distressed, speculative, and structurally challenged cheap stocks, while preserving the genuinely undervalued ones.
Frazzini and Pedersen (2014) formalise this in their Betting Against Beta (BAB) framework, demonstrating that constrained investors bid up high-beta assets, creating a persistent pricing wedge that benefits those able to hold low-beta exposures. When combined with Value, this wedge may be especially pronounced in market segments where speculative activity is concentrated, namely, small and micro-cap stocks.
3. Methodology
3.1 Universe Definition
We test across nine long-only equity universes, segmented by geography and market capitalisation:
United States
- All US Stocks: Liquid US-listed equities passing minimum size and trading volume filters, covering a broad market-cap range.
- Large Cap: Largest US equities by market capitalisation, broadly corresponding to the top quintile of the US market.
- Mid Cap: Mid-capitalisation US equities, broadly corresponding to the second and third quintiles.
- Small Cap: Small-capitalisation US equities, covering companies in the lower range of the investable market.
Europe
- All European Stocks: Liquid European-listed equities passing minimum size and trading volume filters across major European exchanges.
- Europe 600: Broad European universe of approximately 600 securities spanning all cap sizes.
- Europe 200 Large: Largest 200 European equities by market capitalisation.
- Europe 200 Mid: Mid-capitalisation segment, approximately the 201st to 400th largest European equities.
- Europe 200 Small: Small-cap segment, approximately the 401st to 600th-largest European equities.
3.2 Factor Proxy
The Value factor is proxied by a composite ranking system that incorporates multiple valuation metrics, including price-to-earnings, price-to-book, price-to-sales, and enterprise value ratios, consistent with standard academic definitions of the Value factor (Fama and French, 1992). Within each universe, stocks are ranked on this composite signal, and the top 30 by ranking score are selected for the portfolio.
3.3 Beta Segmentation
Each universe is divided into two halves based on the trailing 12-month beta (Beta1Y) relative to the local market (in parenthesis the Portfolio123 reference):
- Low Beta group: stocks ranked in the bottom 50% by beta within the universe (
FRank("Beta1Y") < 50) - High Beta group: stocks ranked in the top 50% by beta within the universe (
FRank("Beta1Y") >= 50)
The Value ranking and portfolio selection (top 30 stocks) are applied independently within each beta group. This design ensures a clean comparison: the same factor signal, the same number of holdings, the same rebalancing frequency (every 4 weeks), applied to two non-overlapping subsets of each universe.
3.4 Backtest Parameters
Before diving into results, here is a quick overview of the backtest setup. These parameters matter because they keep the simulation realistic: we include trading frictions, use point-in-time inputs, and apply the same rules across universes to ensure fair comparisons.
| Parameter | Setting |
|---|---|
| Period | January 2005 – February 2026 |
| Rebalancing | Every 4 weeks |
| Holdings | 30 per beta group |
| Transaction price | Open |
| Slippage | 25 basis points |
| Currency | USD (US universes), EUR (European universes) |
| Point-in-time data | Yes (Preliminary) |
4. Results
4.1 US Universes
The US results set the tone for the whole note. On absolute returns, High Beta often looks stronger. But once we adjust for risk, the edge shifts to Low Beta in most cases.
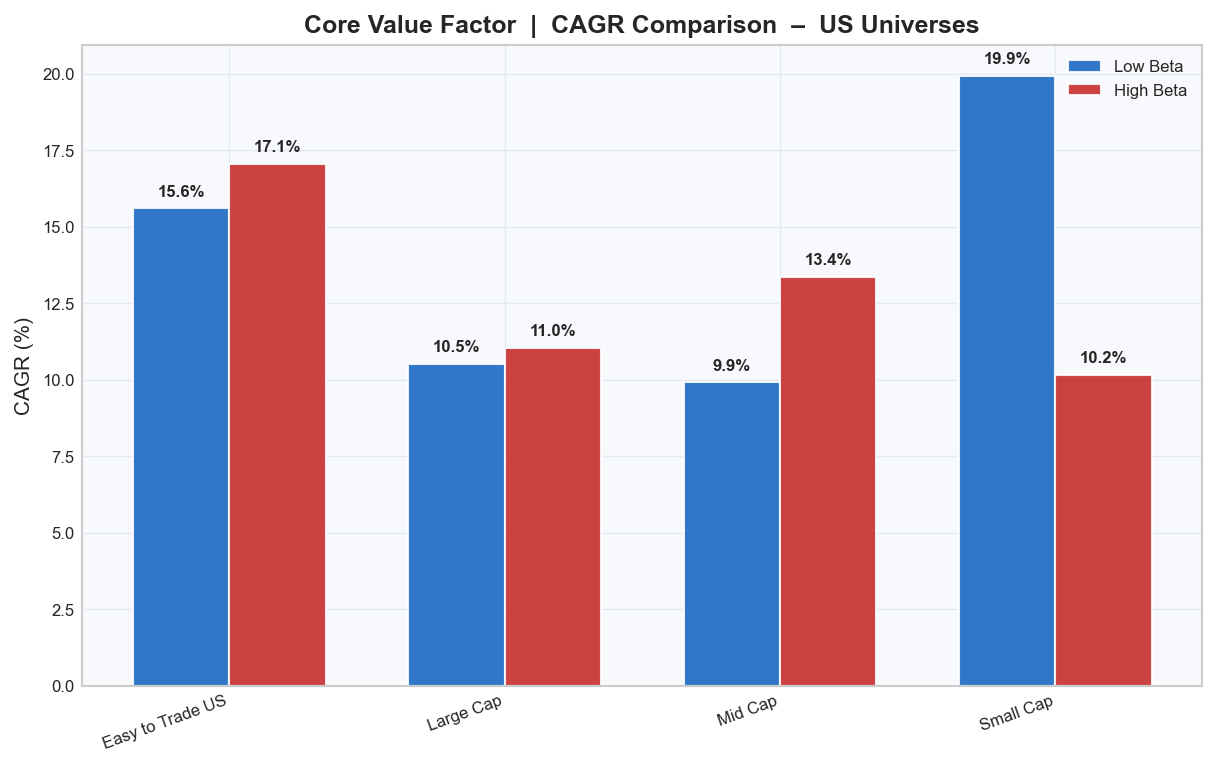
Start with CAGR. High Beta Value leads in three of four US universes. That is not surprising in a long bull market. Higher beta usually means greater market exposure, which can lift raw returns.
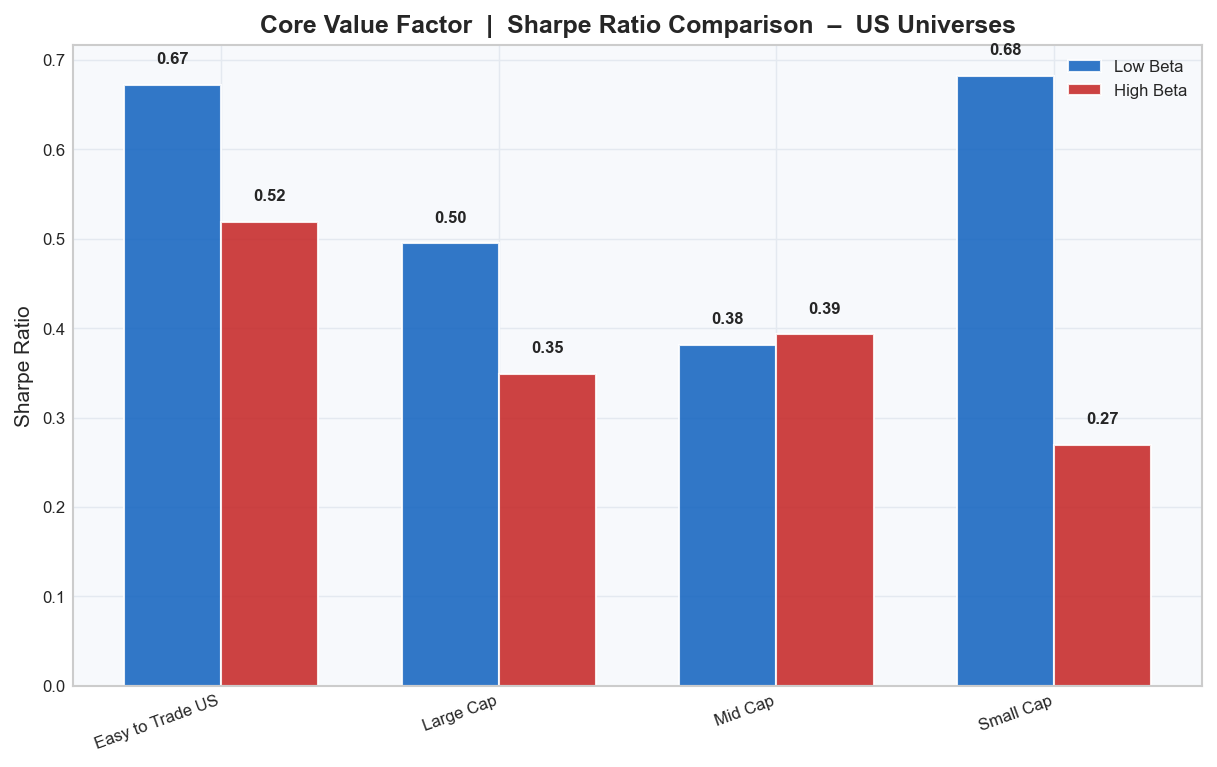
Now look at Sharpe. Across all four US universes, Low Beta Value wins on risk-adjusted performance in three and is essentially tied in Mid Cap (0.38 vs. 0.39). All US Stocks and Large Cap each show a +0.15 Sharpe edge for Low Beta. The pattern is clear: the quality of returns improves when beta is constrained.
Small Cap US is the defining result. Low Beta Value posts a 19.9% CAGR, nearly double that of High Beta Value at 10.2%. The risk-adjusted gap is even wider: 0.68 versus 0.27 Sharpe, a +0.41 edge.
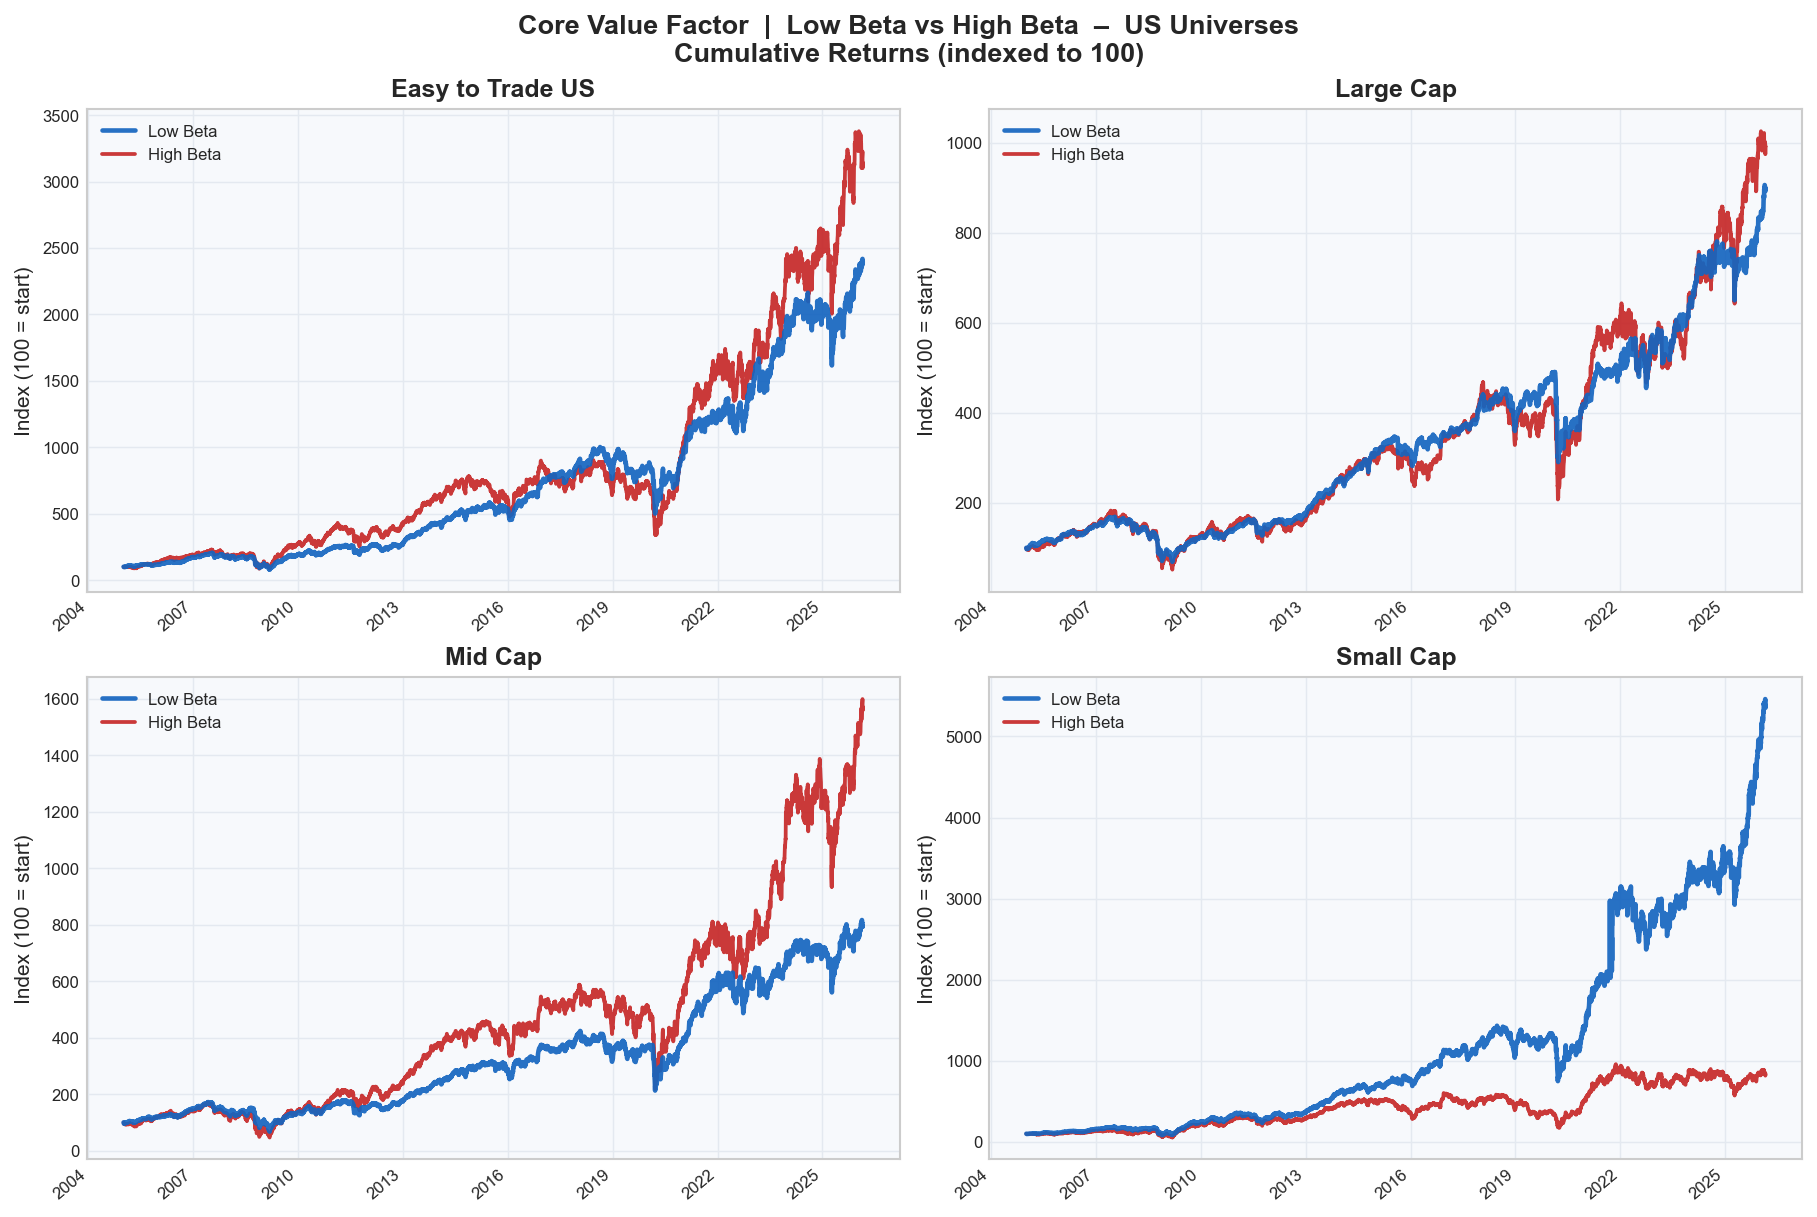
The cumulative line chart makes this gap hard to ignore. Over 2005-2026, Low Beta Small Cap Value compounds to roughly 5,500, while the High Beta version reaches only about 800.
Bottom line for the US: High Beta can boost headline CAGR, but Low Beta delivers better return per unit of risk. In US Small Caps, it improves both.
4.2 European Universes
Europe tells a different story. The same Value split does not produce the same dominance on raw returns. Here, High Beta is stronger on CAGR across the board.
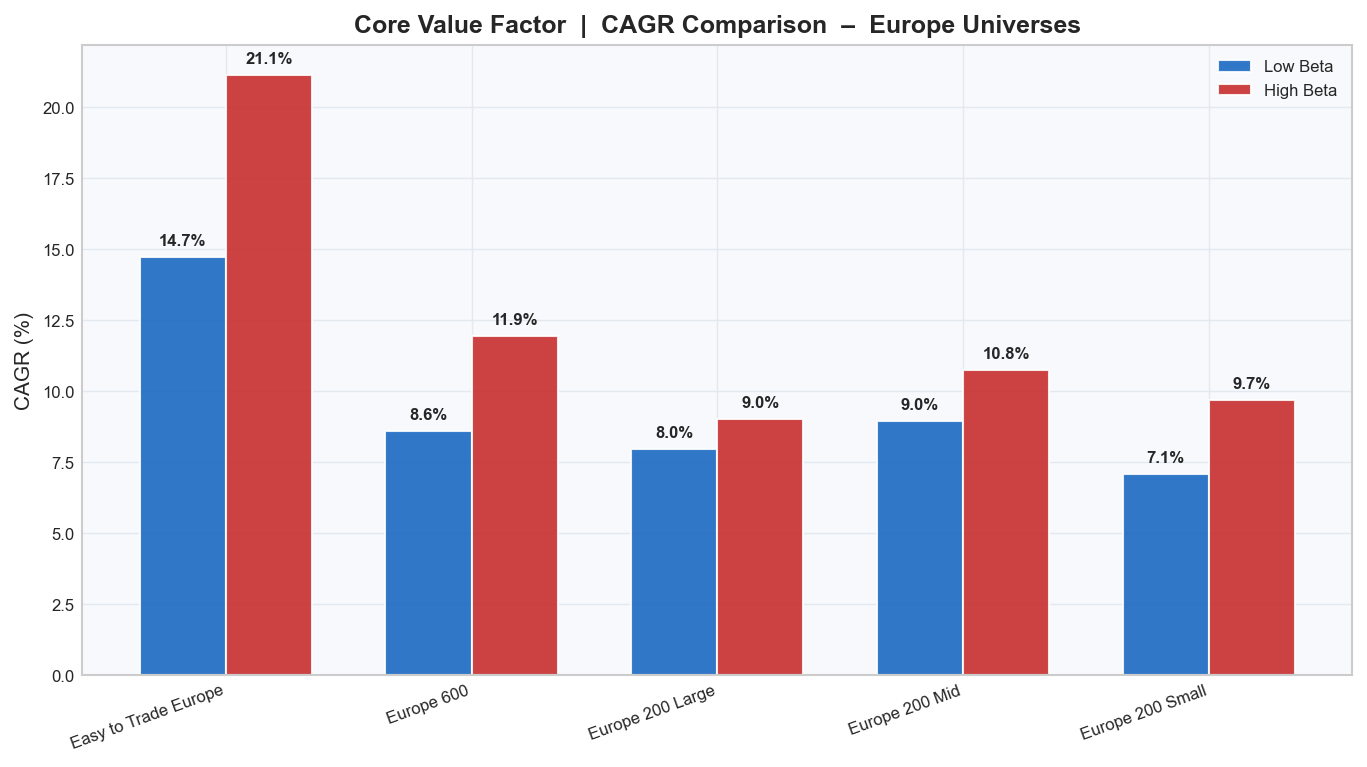
The CAGR chart is unambiguous: High Beta Value outperforms in all five European universes. The biggest gap is All European Stocks, where High Beta delivers 21.1% versus 14.7% for Low Beta.

Sharpe partially offsets that story. Low Beta leads in four of five universes, but the margins are smaller than in the US. All European stocks are the exception, where High Beta is still slightly ahead (1.00 vs. 0.97).
The key contrast with the US is European Small Caps. The US Small Cap effect does not replicate here. Europe 200 Small shows 7.1% CAGR for Low Beta versus 9.7% for High Beta, and only a +0.02 Sharpe edge for Low Beta. Statistically and economically, this is a close tie.
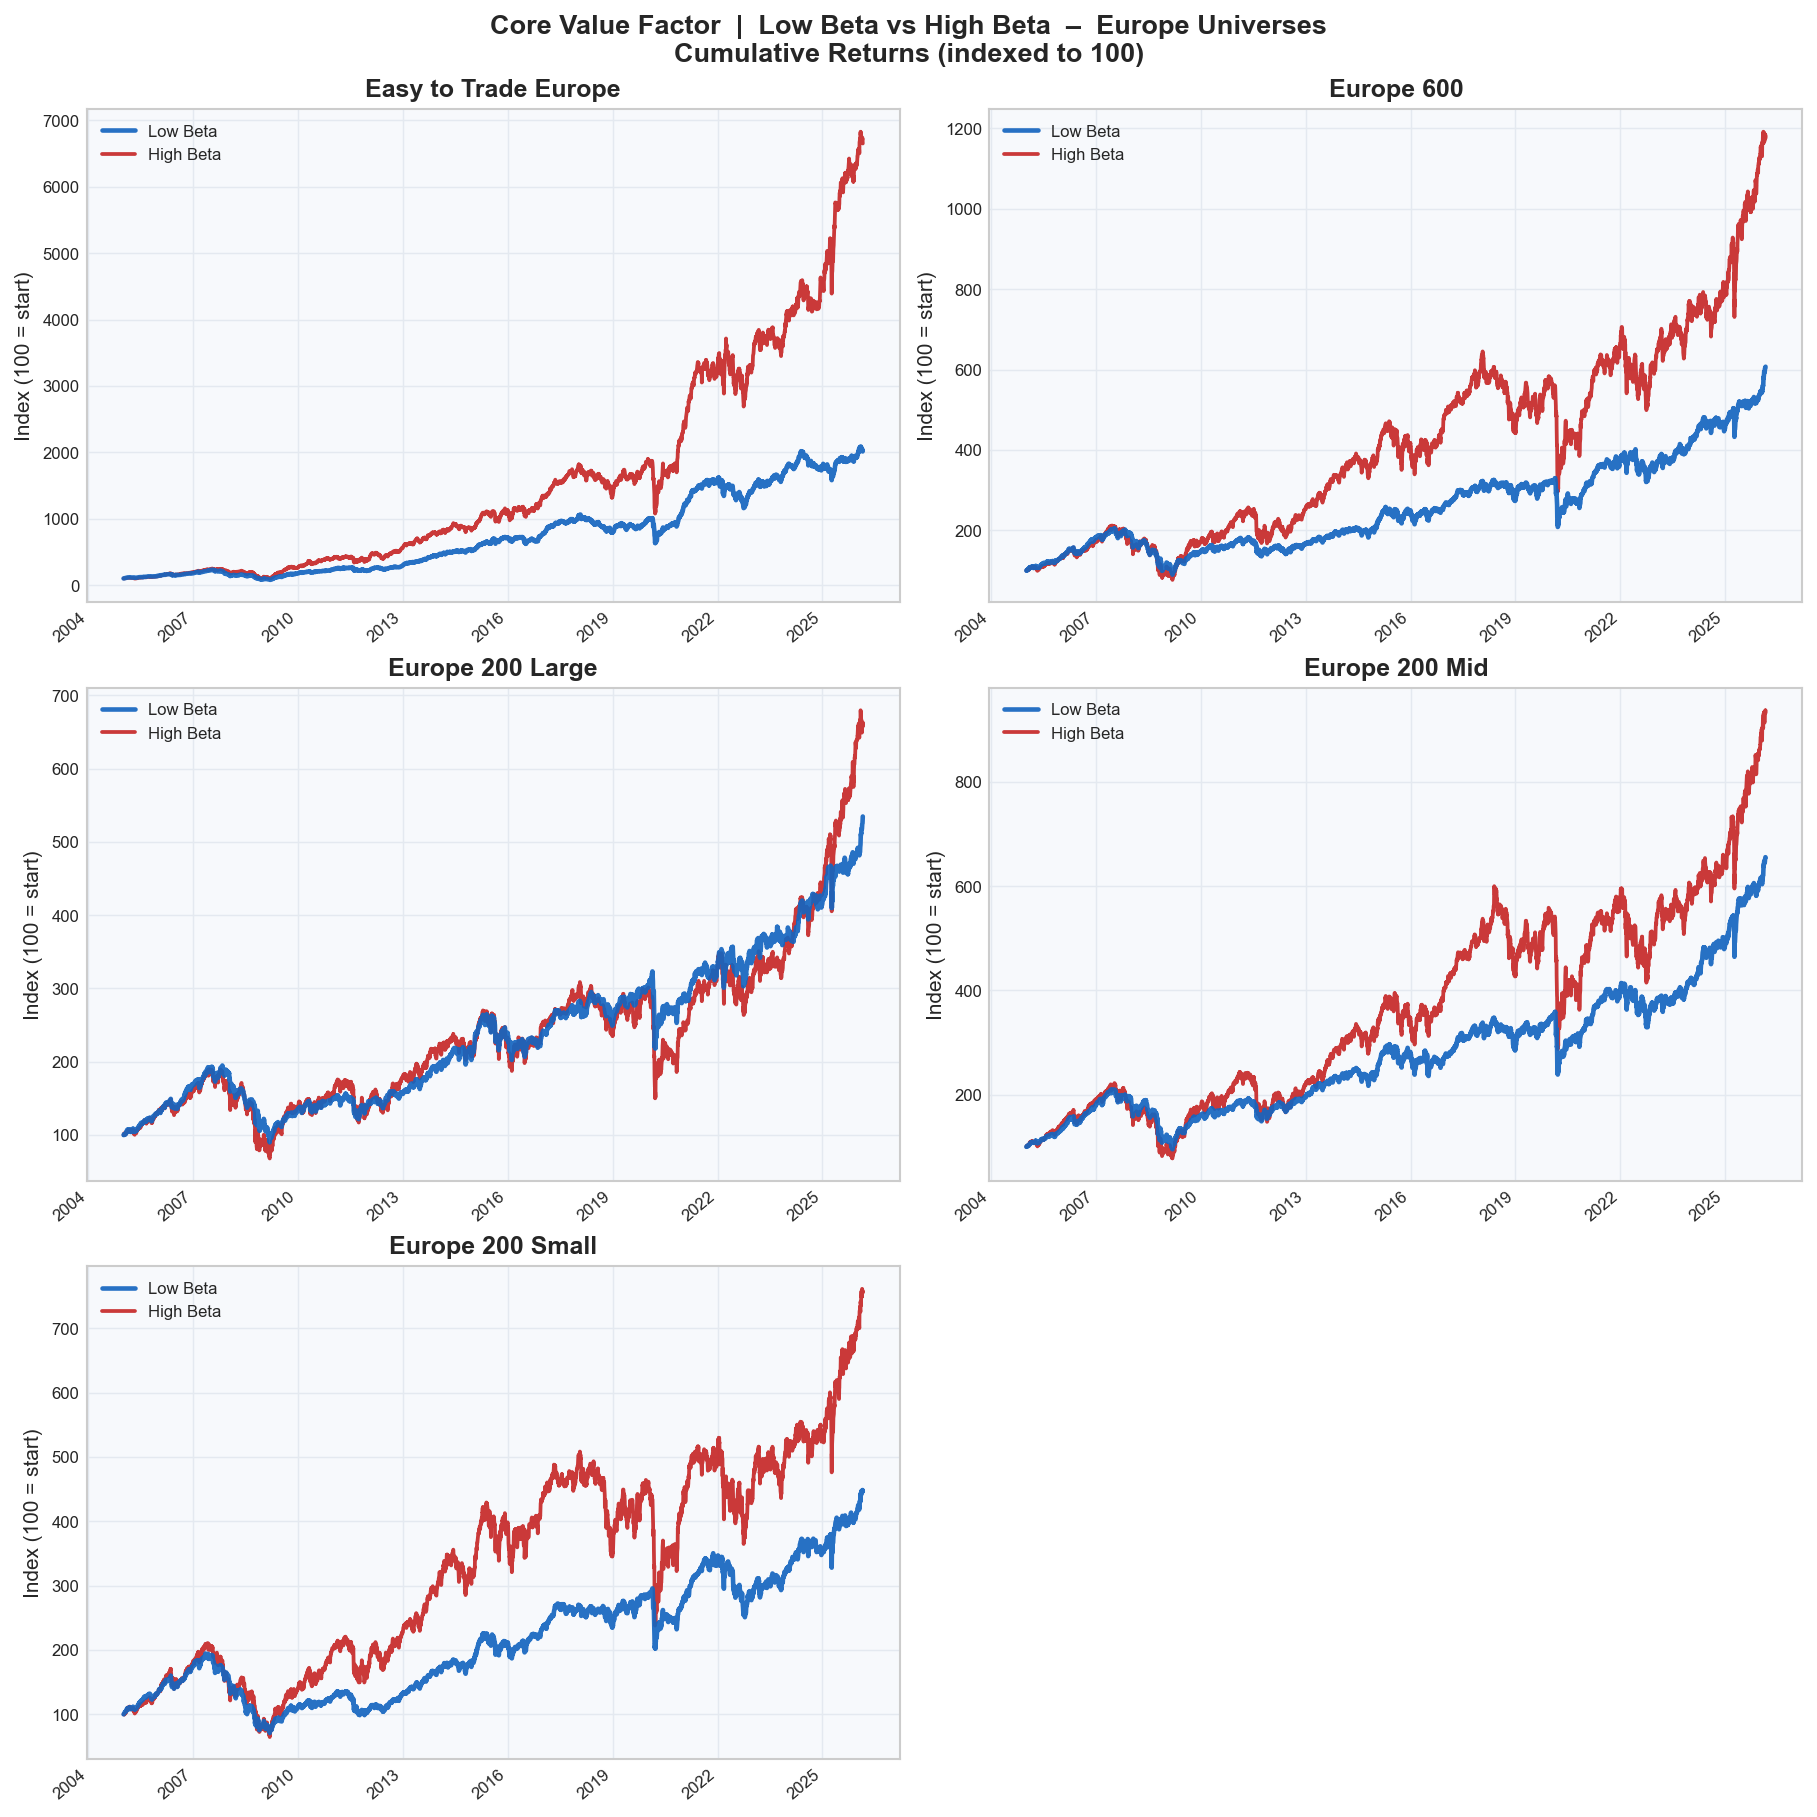
The cumulative curves add another layer: much of High Beta's European advantage stems from strong acceleration after 2020. That recent regime matters, and it argues for caution when extrapolating these CAGR gaps into the future.
Bottom line for Europe: Low Beta improves risk-adjusted returns in most universes, but the effect is modest and does not translate into a clear Small Cap win.
4.3 Summary Statistics
| Universe | Region | Low Beta CAGR | High Beta CAGR | Low Beta SR | High Beta SR | SR Edge |
|---|---|---|---|---|---|---|
| All US Stocks | US | 15.6% | 17.1% | 0.67 | 0.52 | +0.15 |
| Large Cap | US | 10.5% | 11.0% | 0.50 | 0.35 | +0.15 |
| Mid Cap | US | 9.9% | 13.4% | 0.38 | 0.39 | -0.01 |
| Small Cap | US | 19.9% | 10.2% | 0.68 | 0.27 | +0.41 |
| All European Stocks | Europe | 14.7% | 21.1% | 0.97 | 1.00 | -0.03 |
| Europe 600 | Europe | 8.6% | 11.9% | 0.41 | 0.40 | +0.01 |
| Europe 200 Large | Europe | 8.0% | 9.0% | 0.39 | 0.29 | +0.10 |
| Europe 200 Mid | Europe | 9.0% | 10.8% | 0.44 | 0.36 | +0.08 |
| Europe 200 Small | Europe | 7.1% | 9.7% | 0.34 | 0.32 | +0.02 |
5. The Small Cap Asymmetry: US vs. Europe
The most theoretically interesting finding of this study is the sharp divergence between US and European Small Caps. In the US, Low Beta Value Small Caps produce the single best risk-adjusted outcome in the entire study - and the best absolute outcome by a wide margin. In Europe, the same construction adds negligible value over High Beta Value.
We offer three structural explanations for this asymmetry:
1. Depth and heterogeneity of the US small-cap universe. The US small-cap market is substantially deeper and more heterogeneous than its European counterpart. The Russell 2000 contains a large proportion of early-stage, pre-profitability, and highly speculative businesses - biotech, micro-cap tech, exploration-stage resource companies - that drive up average beta and create a wide dispersion between low- and high-beta cohorts. This dispersion is precisely the condition under which beta segmentation adds most value. European small-cap indices, by contrast, tend to be dominated by established industrial, consumer, and financial businesses with more homogeneous risk profiles.
2. The "value trap" concentration in US high-beta small caps. When a small company is both cheap (high Value rank) and high beta, the most likely explanation in the US market is structural distress: companies facing competitive threats, leverage problems, or secular demand declines. These are the classic value traps. In Europe, small caps are more likely to be family-controlled or regionally dominant businesses where cheapness reflects neglect rather than distress, making the high-beta filter less effective as a quality screen.
3. Liquidity and factor crowding. The Low Beta anomaly documented by Frazzini and Pedersen (2014) is theoretically grounded in leverage constraints: investors who cannot use leverage buy high-beta assets to boost returns, pushing their prices above fair value. This mechanism operates most powerfully in the US, where retail speculation and leveraged products are most prevalent in small-cap segments. In European small caps, where institutional ownership is higher and speculative retail activity lower, the beta-pricing wedge is smaller, and the resulting alpha opportunity is correspondingly diminished.
6. Conclusions
This study presents systematic evidence that the Low Beta filter enhances the Value factor primarily on a risk-adjusted basis, with the effect concentrated in US equities. Across 8 of 9 tested universes, Low Beta Value portfolios deliver higher Sharpe ratios than their High Beta counterparts. The trade-off is that High Beta Value portfolios typically generate higher raw CAGR - particularly in Europe - reflecting the mechanical effect of higher market exposure in rising markets.
The central and most actionable finding is the US Small Cap exception: here, Low Beta Value dominates not only on risk-adjusted metrics but also on raw returns, generating nearly twice the CAGR of the High Beta equivalent over a 21-year period. We attribute this to the unique structure of the US small-cap market, where high-beta cheap stocks are disproportionately concentrated in genuinely distressed or structurally impaired businesses.
The European Small Cap non-result is equally informative: the absence of the Small Cap effect in Europe suggests that the beta-segmentation premium is market-structure dependent, not a universal feature of Value investing. Practitioners applying this strategy outside the US should expect narrower benefits confined to the Sharpe dimension.
From a portfolio construction standpoint, these findings suggest that combining Low Beta with Value offers a compelling risk-return profile in the US Small Cap space. In this specific interaction, the beta filter appears to serve as a practical quality screen - helping to avoid value traps in market segments characterised by high speculative activity and wide dispersion of business quality. Whether this benefit extends to other factor combinations remains an open question for future research.
References
Black, F. (1972). Capital market equilibrium with restricted borrowing. Journal of Business, 45(3), 444-455.
Fama, E. F., & French, K. R. (1992). The cross-section of expected stock returns. Journal of Finance, 47(2), 427-465.
Frazzini, A., & Pedersen, L. H. (2014). Betting against beta. Journal of Financial Economics, 111(1), 1-23.
Novy-Marx, R. (2013). The other side of value: The gross profitability premium. Journal of Financial Economics, 108(1), 1-28.
Asness, C. S., Frazzini, A., & Pedersen, L. H. (2019). Quality minus junk. Review of Accounting Studies, 24(1), 34-112.
This research note is produced for informational purposes only and does not constitute investment advice. Past performance of backtested strategies is not indicative of future results. All backtests are subject to look-ahead bias, survivorship bias, and other limitations inherent to historical simulation.
Enjoyed this note?
Get weekly curated research on systematic investing, asset pricing, and machine learning delivered to your inbox.